Data Pipeline
This section describes this project’s pipeline from raw data inputs to model predictions. It can be a useful reference for those who want to:
- Troubleshoot project code.
- Understand the sequence of analytical steps.
- Assess the status of different modeling initiatives.
Overview
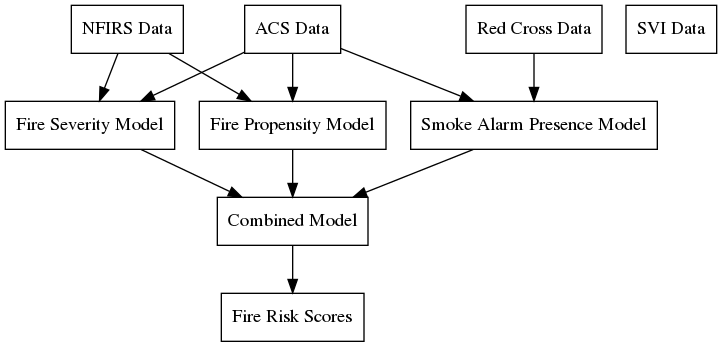
At a high level, this project uses several data sources to predict the probability and severity of fires in the US at the census block level, as well as the prevalence of smoke detectors.
Data Sources
We use the following data sources to train models and make predictions.
NFIRS Data
The National Fire Incident Reporting System (NFIRS) has data on fires and other incidents reported by fire departments across the US. This voluntary system captures about 70% of estimated fire incidents each year (ref?).
We use eight years of data with approximately 250K cases per year, for a total of 2M fire incidents. We assign each incident to a census block after cleaning and geocoding the reported addresses.
Todo
Document the NFIRS raw data.
- Identify the years we use.
- Describe the cleaning and geocoding steps.
- Describe how the data will grow.
- Link to relevant code in docs.
ACS Data
The American Community Survey (ACS) has detailed demographic and housing data for communities across the US. The ACS data include 74,134 census tracts and 211,267 census block groups.
Todo
Document the ACS raw data.
- Describe the types of variables we’re interested in.
- Describe the geographic granularity & extent.
- Identify the years we use.
- Describe how the data will grow.
- Link to relevant code in docs.
Red Cross Data
Since 2014 the American Red Cross has documented their campaigns to install free smoke alarms in homes that need them. We use these data to identify areas that tend to need this service. These data include about 900K cases.
Todo
Document the Red Cross raw data.
- Describe how to acquire the data.
- Identify the years we use.
- Describe how the data will grow.
- Link to relevant code in docs.
Models
Fire Severity Model
Todo
Describe the fire severity model.
- Describe the general purpose.
- Describe the input data and any transformations.
- Describe the outcome variable.
- Describe the features.
- Describe the modeling approach.
- Link to any relevant code.
Fire Propensity Model
Todo
Objective: Predict which Census Geographies will be in >90th percentile of total # of home fires the following year
- Inputs: NFIRS (national fire incidents reporting) and ACS (census demographics)
- ‘NFIRS Fire Incident Data.csv’ (2009-2016)
- Hundreds of thousands of records with each record representing a fire incident in a US location
- ‘ACS 5YR Block Group Data.csv’ OR ‘ACS 5YR Tract Data.csv’ (2013-2017)
- Hundreds of thousands of records with each record representing the demographics of a census geoid
- New NFIRS & ACS data is released each year
- Data Transformation:
- NFIRS:
- Aggregated individual fire incidents into tabular format (records # of fires in each year in each geoid)
- Normalized number of fires by total population in the respective geoid
- ACS:
- Removed non-numeric variables
- Removed 9 variables that are highly correlated with other variables in the dataset
- Outputs: Label predictions (0: not Top 10%, 1: Top 10%) & prediction probabilities for each census geography
- ‘PropensityBlockModel_2014_2016.csv’ - provides predictions for years 2014-2016, but can be updated each year
- Model: Balanced Random forest Model using Python imb-learn package
- Script: ‘NFIRS_Block_level.ipynb’
- Training Method: leverage all available data prior to target prediction year
- Training Method Example: to predict 2016 top 10%, train on NFIRS 2009-2015 & ACS 2013-2015
- Each record represents the feature values for a single geoid
- Features: the below features were selected from a larger group of ~100 b/c model importance score is > 0.01:
- Sum of fires over selected years in the given geoid
- Mean number of fires over selected years in the given geoid
- Max number of fires over selected years in the given geoid
- % of houses in geoid built before 1939
- % of houses in geoid that are occupied
- % of houses in geoid whose heating source is kerosene
- % of houses in geoid with just a single occupant
- % of houses in geoid inhabited by married couple
- % of people in geoid with a bachelors degree
- % of people in geoid that have worked within the past year
- % of people in geoid that are black
- % of houses in geoid occupied by the owner
- % of people in geoid that have attended college but not graduated
- % of houses in geoid with value between $175-200K
- % of houses in geoid with value between $200-250K
- % of houses in geoid with a home equity loan
- Preliminary Results: - 65-75% weighted Avg Recall at the Census block level - 75-85% Recall at the Census tract level
Smoke Alarm Presence Model
Todo
Describe the smoke alarm presence model.
- Describe the general purpose.
- Describe the input data and any transformations.
- Describe the outcome variable.
- Describe the features.
- Describe the modeling approach.
- Link to any relevant code.
Combined Model
Todo
Describe the combined model.
- Describe the general purpose.
- Describe the input data and any transformations.
- Describe the outcome variable.
- Describe the features.
- Describe the modeling approach.
- Link to any relevant code.